Chartsy is an AI-assisted analytics and visualization platform for SaaS companies. It provides a no-code interface to turn Paddle billing data into interactive charts and dashboards for tracking revenue, churn, lifetime value, and growth trends in real time.
Chartsy connects to Paddle Billing via a read-only API key. After connecting, metrics sync automatically and can be explored by segment to visualize performance.
It is designed for founders, finance teams, and product managers who need clear, shareable insights. Reports can be exported as PDF or PNG and shared with stakeholders.
Use Cases
- Data-driven growth decisions: Visualize key metrics (MRR, ARR, churn, and customer LTV) to identify trends and bottlenecks and inform growth decisions. Replace manual spreadsheets and exports with interactive dashboards based on Paddle data.
- Subscription performance tracking: Monitor active subscribers, upgrades, downgrades, and churn to understand customer behavior over time. Use insights to improve retention and lifetime value.
- Executive and investor reporting: Produce presentation-ready reports directly from Paddle data. Export PDF or PNG charts for board meetings, investor updates, and quarterly reviews.
- Real-time business health monitoring: Track current performance—from daily revenue changes to customer acquisition trends—with automatic updates and AI-generated dashboards.
Key Features
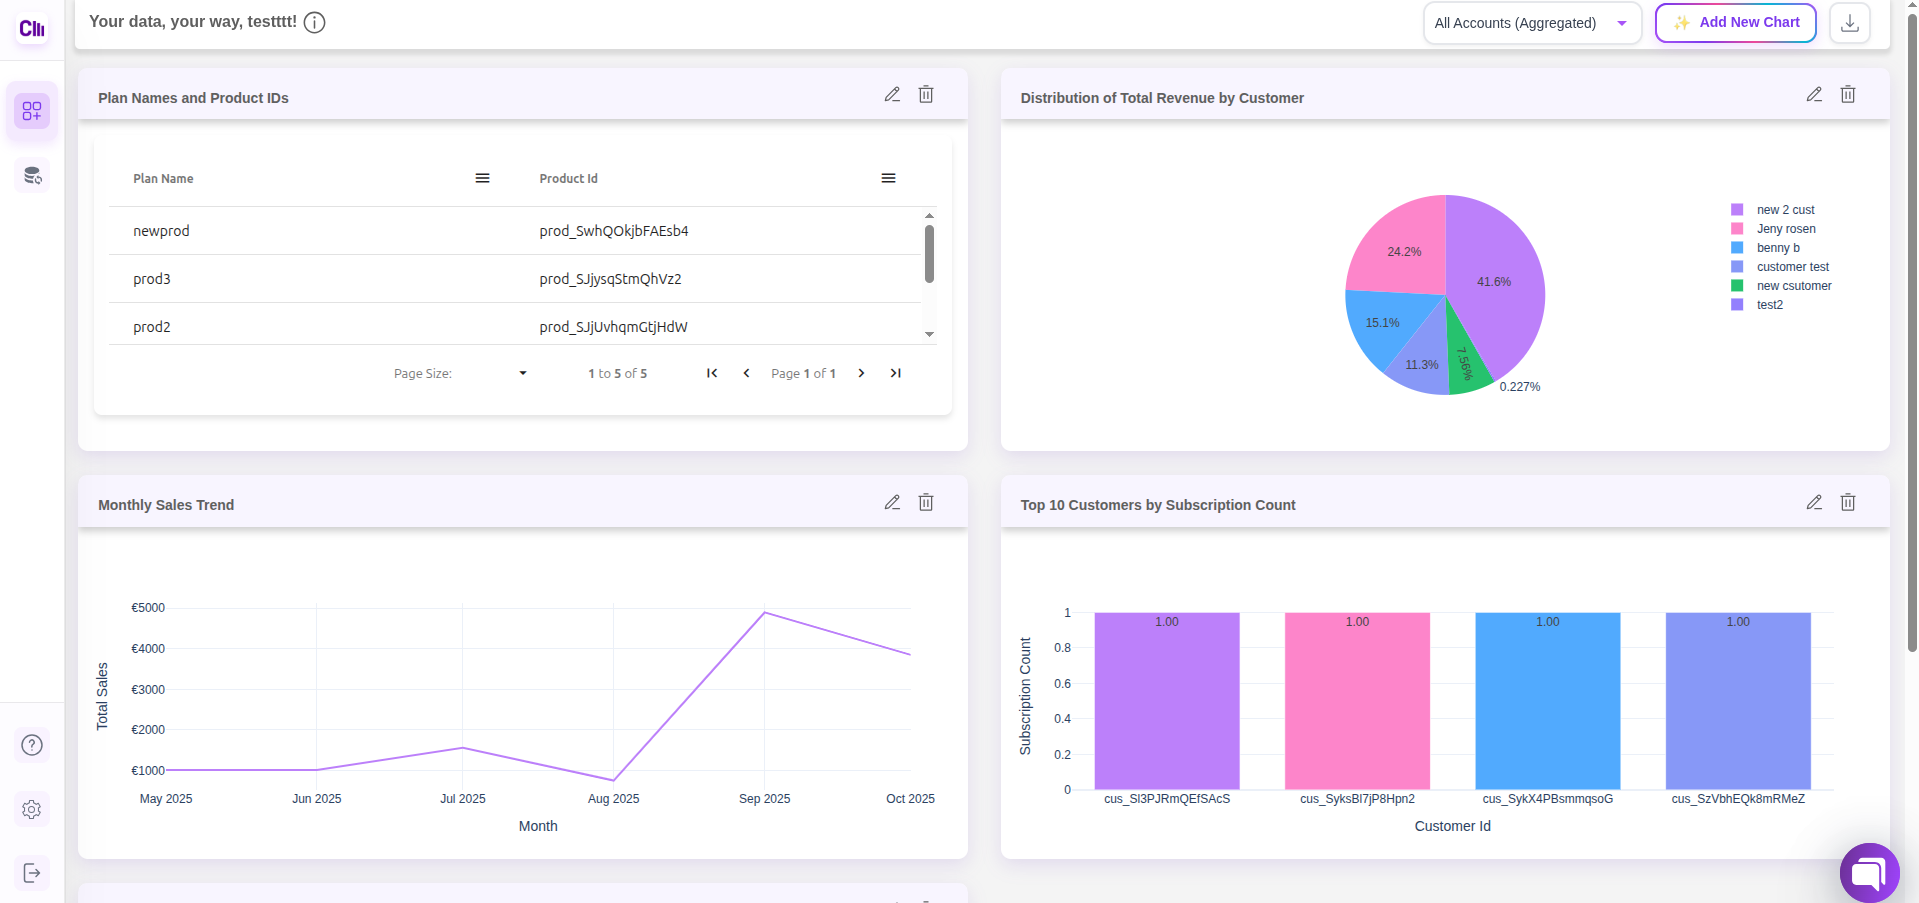
- AI-powered dashboard generation: Ask questions in plain English (e.g., "What was our churn rate this quarter?"). Chartsy interprets the data, selects an appropriate visualization, and generates the chart or dashboard.
- Custom visualizations without code: Create and customize interactive charts and dashboards without SQL or code. Choose bar, line, pie, and other visuals to match business needs.
- Export and share reports: Export charts and dashboards as PNG or PDF for presentations and stakeholder communication.
- Real-time data synchronization: Dashboards reflect the latest metrics automatically, enabling monitoring of KPIs such as MRR, churn, and ARR without manual refreshes or exports.
Paddle Integration
Chartsy integrates with Paddle Billing via the API
